Ship insights faster
Visual data pipelines.
In your browser.
Upload or fetch data, transform it with nodes, and chart the result — then share the pipeline with your team.
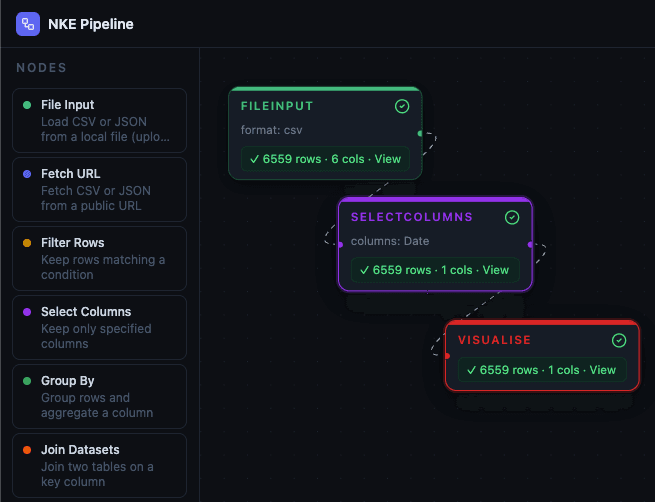
Drag nodes, connect edges, run, and inspect results — all in the browser.
How it works
From raw data to shareable insight
A simple workflow that stays readable as it grows.
1) Load
Upload CSV/JSON or fetch from a public URL.
2) Transform
Filter, select, sort, group, and join datasets with nodes.
3) Visualise
Render bar/line/pie charts and inspect results in a paginated table.
Node library
Everything you need to build a pipeline
Accurate to the current app: 8 nodes (sources, transforms, visualise).
Results
Charts + paginated tables
Inspect outputs confidently — even with large datasets.
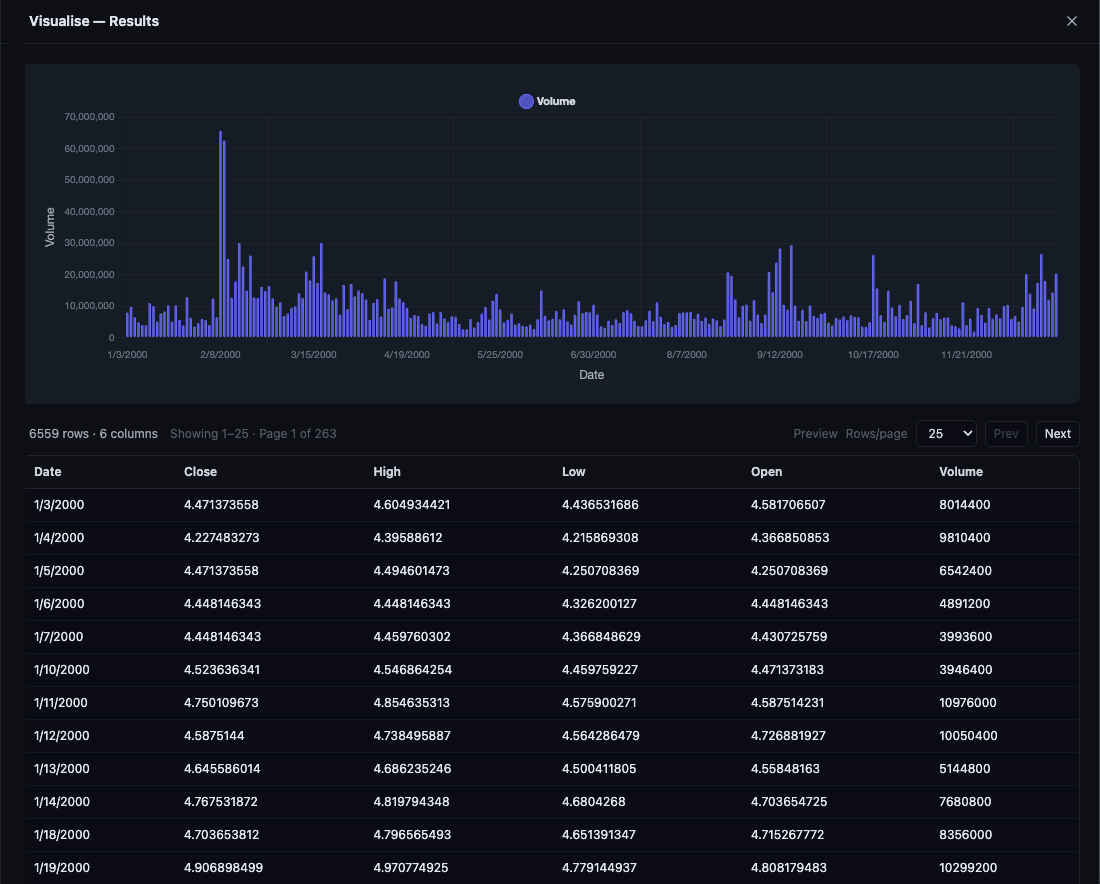
Fast on big data
The UI shows a preview and fetches result pages on demand for smoother performance.
Better charts
Bar/line charts optimize labels; pie charts include a scrollable legend for long categories.
One-click viewing
Open results from the node itself or from the configuration panel.
Share & collaborate
Pipelines you can send, fork, and co-edit
Built-in collaboration patterns for teams.
Public & private sharing
Share read-only views or keep pipelines private.
Fork pipelines
Create a copy of a shared pipeline and iterate safely.
Invites & roles
Invite collaborators as viewer or editor.
Access requests
Request edit access and let owners approve/deny.
Security
Guardrails for URL data fetches
Designed to keep URL-based imports safe-by-default.
CORS-friendly
Fetch URL routes through a server proxy to avoid client-side CORS issues.
SSRF protections
Blocks unsafe hosts/IP ranges and enforces safe content types.
Size limits
Caps responses to keep the app fast and predictable.
FAQ